Form 3 Biology questions and answers:growth and development
The graph below represents the increase in the number of yeast cells over a period of 48 minutes.
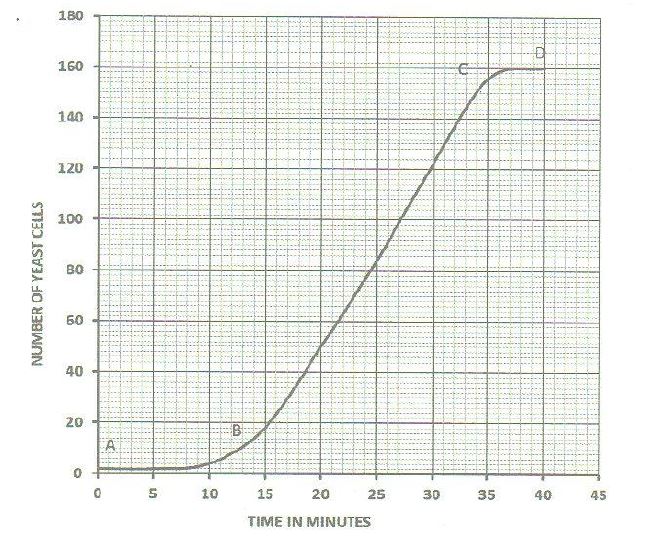
(a) Name the type of curve show
(b) Determine the number of yeast cells after 26 minutes
c) Work out the rate of cell division between 24 and 28 minutes
(d) After how long was the population of yeast cells 128?
e) Name the phase of the curve labelled
(i) A to B
(ii) B to C
(f) Give reasons for the shape of the graph between points C and D
(g) State five factors, which would cause human population growth to assume the shape of the graph curve between points B and C
Viewed: 1093 times
Share in:


Explanation/Answer Text:
a)- Sigmoid curve
b)
no. of yeast cells=#92underline+#1
c)
rate of cell division=#(110-78)/4#
=8 cells/min#underline+1#
d)
31#underline+#1 minutes
e) i) - Lag phase/ slow growth rate
ii)- Exponential phase/ log phase/rapid growth rate
f)- Slow/reduced growth due to limiting environmental factors e.g lack of conducive temperature, limited amount of food,competition for resources.
- Rate of multiplication is almost is almost the same as the death rate and few cells are still dying.
g)- Low death rate
- High birth rate/ high fertility
- Enough food/ availability of food.
- Absence of war/ political stability/ peace.
- Improved standard of living