<=Back
Viewed: 958 times
Share in:


<=KNEC Craft Certificate in ICT module 1 Operating Systems past paper: July 2019
Table 1 shows different processes with their arrival and execution time. Use it to answer the questions that follow.
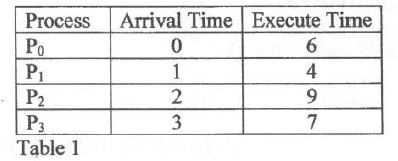
(i) Draw a Grant chart to represent the scenario for using the round robin (RR) scheduling algorithm.
(ii) Using the first come first served (FCFS) scheduling algorithm. Calculate the average waiting time for this scenario. (3 marks)
(i) Draw a Grant chart to represent the scenario for using the round robin (RR) scheduling algorithm.
(ii) Using the first come first served (FCFS) scheduling algorithm. Calculate the average waiting time for this scenario. (3 marks)
Viewed: 958 times
Share in:
Questions List:
1. Richard intends to install an operating system in his new computer. Explain two requirements that should be considered before installation
2. Describe each of the following disk arm scheduling algorithm as used in operating system. (i) Elevator; (ii) Shortest seek time first.
3. Explain two advantages of flash memory over compact disks storage media.
4. Netcom company ltd, a mobile communication device manufacturer intends to install the android mobile operating system in their new device, explain two advantages the company would gain from using this operating system
5. Define each of the following terms as used in operating system: (i) Multiprogramming; (ii) Multitasking.
6. With the aid of a diagram, describe spooling technique as applied in operating system
7. Define each of the following terms as used in operating system. i)Polling ii)Pipe
8. Explain the two functions of directories in a computer system
9. Computer users are advised to set strong password to protect data. Outline four characteristics these passwords should possess
10. Differentiate between dynamic loading and dynamic linking as used in memory management
11. Outline three reasons for implementing threads at the user level
12. Outline three differences between a process and a thread as used in operating systems
13. The process control block of an operating system comprises of different types of information. Explain three types of this information
14. State three categories of system calls, giving an example in each case
15. Explain the three components of disk access time in an operating system
16. Table 1 shows different processes with their arrival and execution time. Use it to answer the questions that follow. (i) Draw a Grant chart to represent the scenario for using the round robin (RR) scheduling algorithm. (ii) Using the first come first served (FCFS) scheduling algorithm. Calculate the average waiting time for this scenario. (3 marks)
17. Outline three advantages of an operating system that supports batch processing
18. The computer system is made up of different buses that facilitate input/output processes. Explain three of these buses
19. Operating system deadlocks are due to various causes. Outline three of these causes, stating a mechanism to prevent each
20. Define the term virtual machine as applied in device management
21. Describe paged memory management technique as used in operating system
22. Spedy communication company has embraced the use speech recognition technology. Explain three ways in which the company could apply the technology
23. During an operating system lesson, teacher discussed various types of operating system structure. Describe two of these structures
24. Outline the characteristic of an electronic file set with each other of the following attributes. (i) Hidden; (ii) Read only.
25. Describe each of the following file allocation techniques: (i) linked; (ii) indexed.
26. Disk operating system commands are divided into two major categories. Explain each of these categories, giving examples in each case
27. Distinguish between best fit and first fit storage placement policies as used in operating systems